Mobile consumers are downloading and using more apps than ever before. According to recent data from App Annie, mobile users now have 93 apps on their phone as of the end of 2019, up from 85 apps at the end of 2015. They also now use around 41 apps per month, up from 35 in 2015. Related to this increase, users are now also spending more hours per day using apps. Worldwide, daily time spent in apps has grown to 3.1 hours per day in 2019, up from 2.1 hours per day in 2015, for instance.
But with that growth has also come increased diversity among the top apps, the report found. That means top apps now make up a smaller proportion of consumers’ total time spent in apps, compared with five years ago.
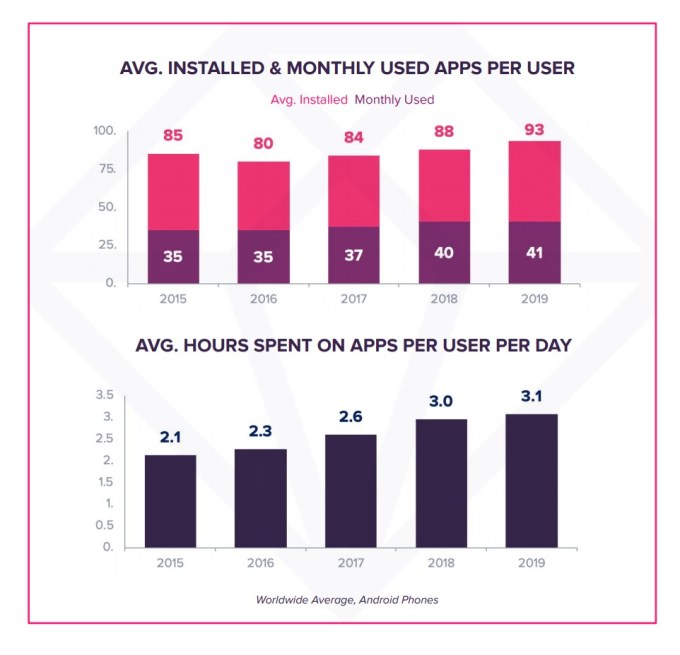
Image Credits: App Annie
It’s worth noting that this report was commissioned by Facebook, App Annie says, with a goal of offering a more detailed look at the evolving app ecosystem over the past five years. The report aims to determine how growth is playing out in terms of popular app categories, among the top publishers, and how quickly newly successful apps are achieving sizable growth.
Facebook, in the past, had generated this sort of market research data first-hand by way of its Onavo VPN application — now shuttered over privacy concerns — and other similar efforts.
Turning to App Annie’s data team is just a new way for the company to get at the same sort of data.
App Annie’s market analysis, in part, is similarly derived by way of third-party apps. The company acquired Distimo in 2014, and as of 2016 has run the VPN app Phone Guardian under the Distimo brand. It also acquired Mobidia in 2015 and has operated My Data Manager (now on the App Store under Distimo). Both apps disclose their relationship with App Annie and explain that the apps are used for market research purposes, with specific examples of the type of data collected.
The new report’s findings may not be all good news for Facebook and other top app publishers. As the app economy evolved, users now have more places to spend time on mobile.
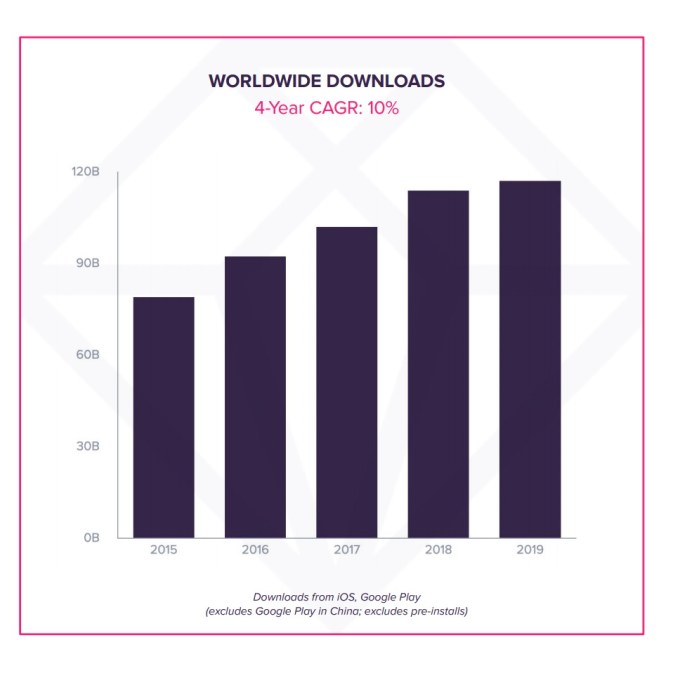
Image Credits: App Annie
Over the past five years, worldwide downloads continued to grow to reach a record of 120 billion in 2019, with several key countries now driving growth including India (10% year-over-year growth in 2019), Brazil (9%), Indonesia (8%) and Russia (7%).
Downloads in mature economies also hit record levels in 2019, including the U.S. (12.3B), Japan (2.5B), U.K. (2.1B), South Korea (2B), Germany (1.9B), and France (1.9B).
As users grew their time in app to 3.1 hours per day, they also began to use more of a variety of apps. According to the report, 35 of the top 100 apps were new entrants in 2019, up from 27 in 2016 across categories that included social, photography, video, communications, entertainment, and more.
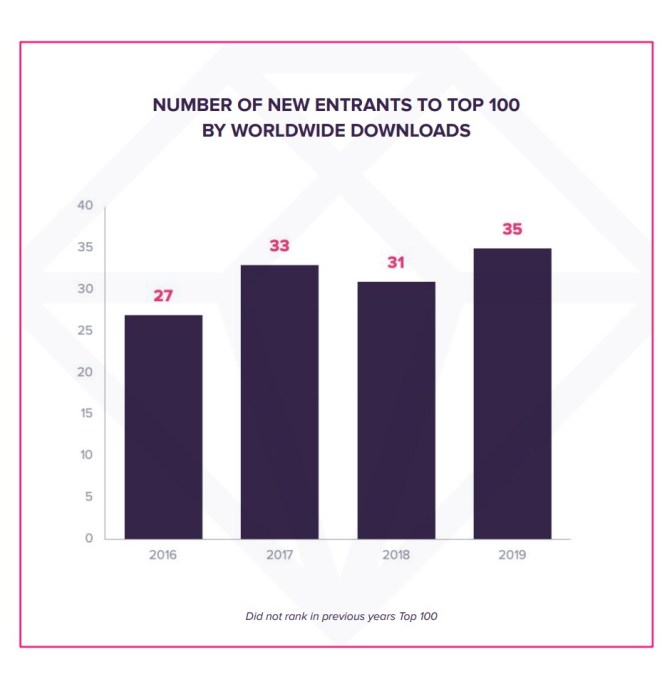
Image Credits: App Annie
This is likely worrisome data for top app publishers, like Facebook, which has for years maintained a suite of top apps including not only its flagship app, but also Instagram, Messenger, and WhatsApp. As the competitive pressure increases, these top apps make up a smaller proportion of the time spent on mobile devices as users have grown more comfortable trying out newcomers — particularly across gaming, entertainment, and video categories.
The top 30 non-game apps accounted for 69.4% of U.S. users’ total time spent in 2016 among non-games. That dropped to 65.5% in 2019, a nearly 4% decline. Among games, the share fell from 49% to 39%, a 10% drop. (This data was sourced from Google Play in the U.S.)
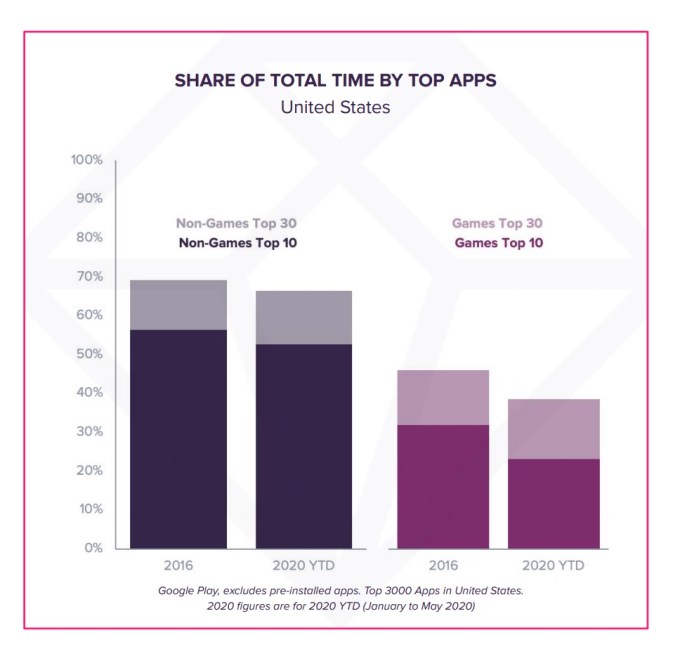
Image Credits: App Annie
Not only are consumers more open to trying new apps, the report found that new apps can also quickly achieve app store success. In the U.S., for example, over 60% of apps are able to reach their category’s Top 30 in their first 6 months.
This is aided by larger initial marketing pushes as well as improvements in terms of consumer’s devices themselves — like more storage and processing power, which encourages more downloads.
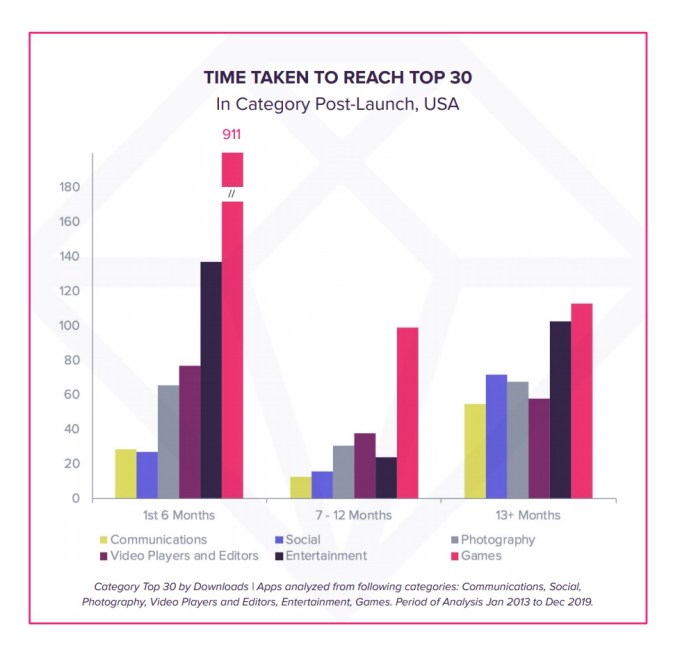
Image Credits: App Annie
There are also more apps than ever before capable of achieving the once milestone metric of 1 million monthly active users (MAUs). In 2019, over 4,600 apps saw 1 million MAUs, including those outside of social and communications like Netflix, Roku, Disney, CBS, Amazon, Alibaba, Walmart, Target, PayPal, Venmo, Chase, Capital One, Uber, DoorDash, McDonald’s, and Starbucks.
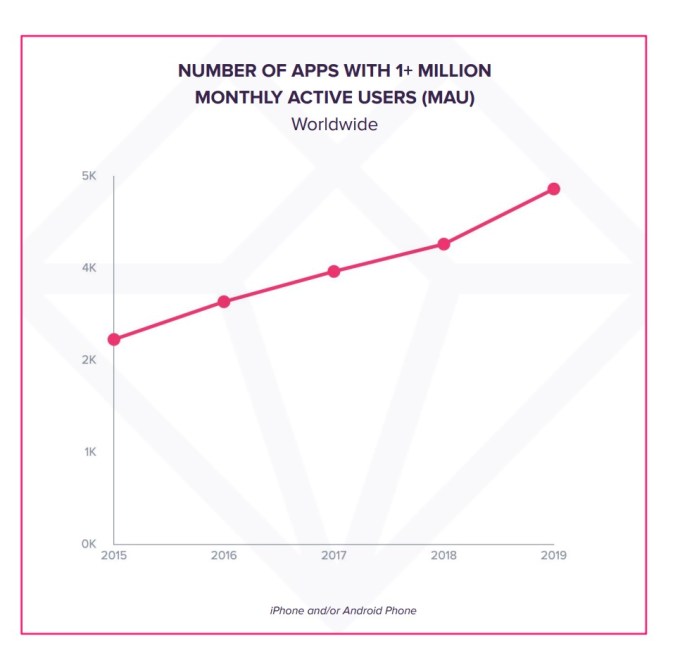
Image Credits:
Apps are also achieving the 1 million downloads milestones more quickly, in data analyzed from 2015 to 2018. In the video, finance, communications, social, photo, and entertainment categories, 67% of apps achieved the 1 million downloads milestone within their first 12 months, App Annie says.
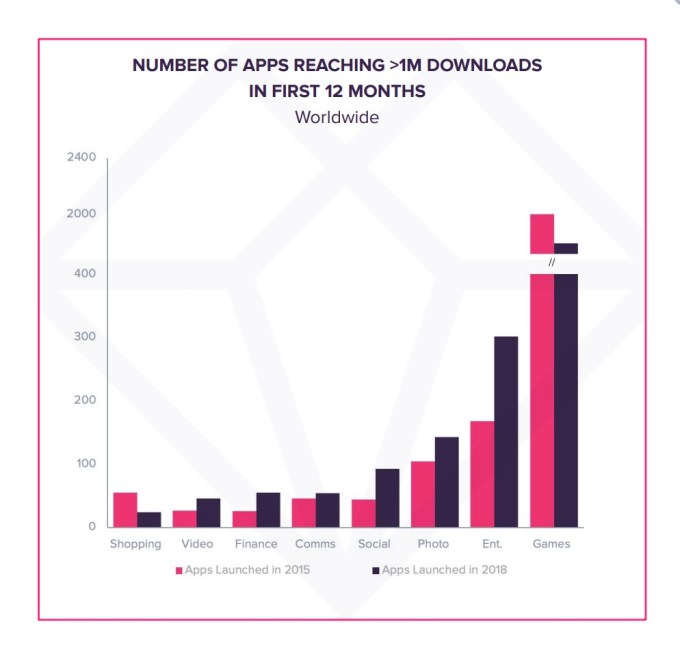
Image Credits: App Annie
Because of the increases, there’s now a lot of overlap in between top apps. Today, mobile consumers will often choose and use multiple apps within and across categories to address similar needs, including on social, the report found.
For example, 89% of Snapchat’s users also used YouTube in April 2020 in the U.S., and 75% also used Instagram.
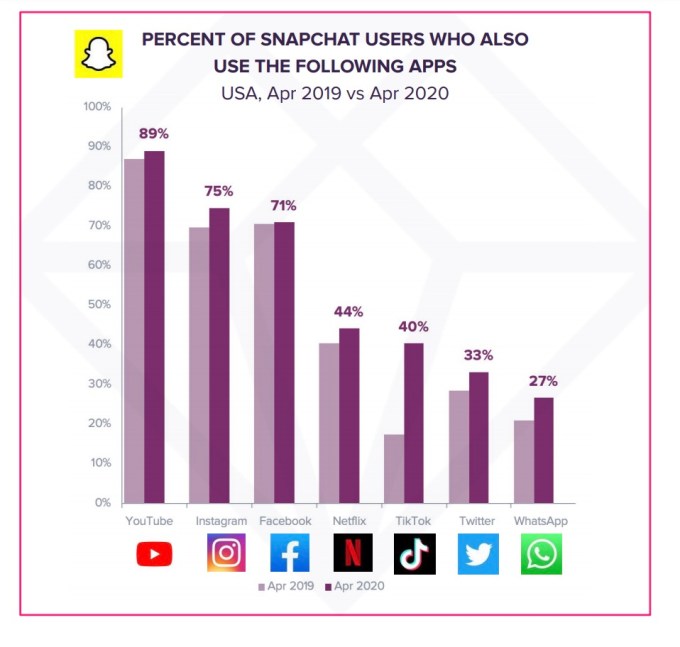
Image Credits: App Annie
TikTok saw the greatest year-over-year increase in cross-app usage of Snapchat, rising from 17% in April 2019 to April 2020 — an indication of how much it has captured the youth demographic.
Meanwhile, video apps and gaming are taking up more of users’ time spent in apps. This broad category of “play”-focused apps accounted for 22% of the growth in time spent in apps in 2019.
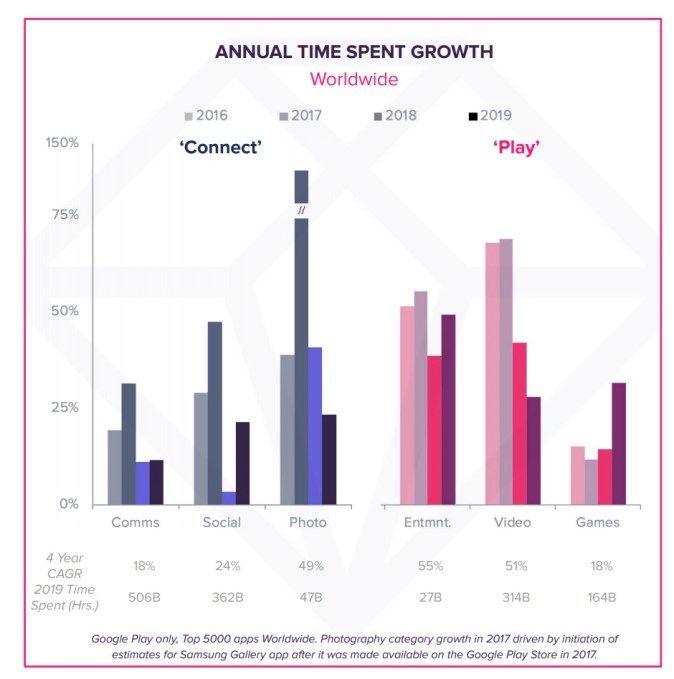
Image Credits: App Annie
Plus, top gaming apps are also implementing social features, including Top 50 games like Fortnite, Clash of Clans, Call of Duty: Mobile, Township, Star Wars: Galaxy of Heroes, New Yahtzee With Buddies, Golf Clash, and Slotomania, for example.
More than two-thirds of the Top 50 games have added at least one social feature, whether that’s inviting friend to play, social assists for progressing, guilds or clans, or in-app chat. This, in turn, has led to players spending more time in games as they can connect with friends there.
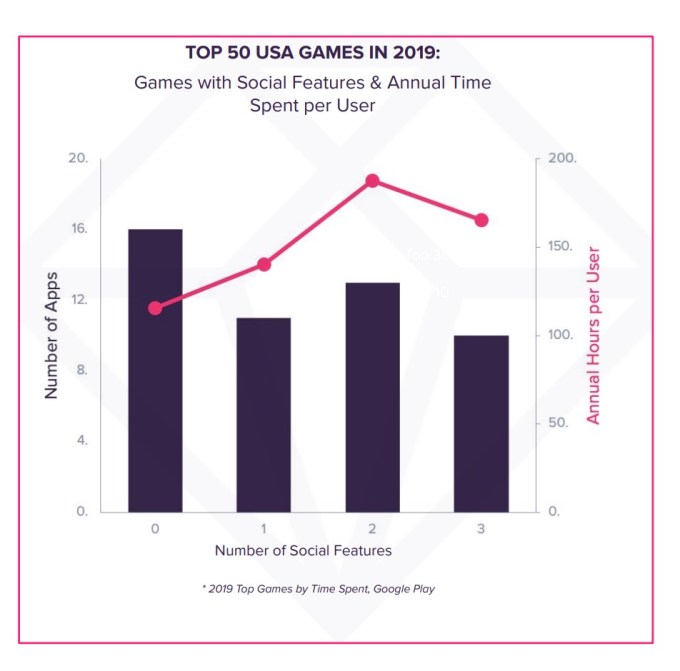
Image Credits: App Annie
Fortnite, as one key example of this trend, rolled out Party Hub based on its acquired Houseparty technology, in September 2019. In the three months after the rollout, time spent in Fortnite grew 130%.
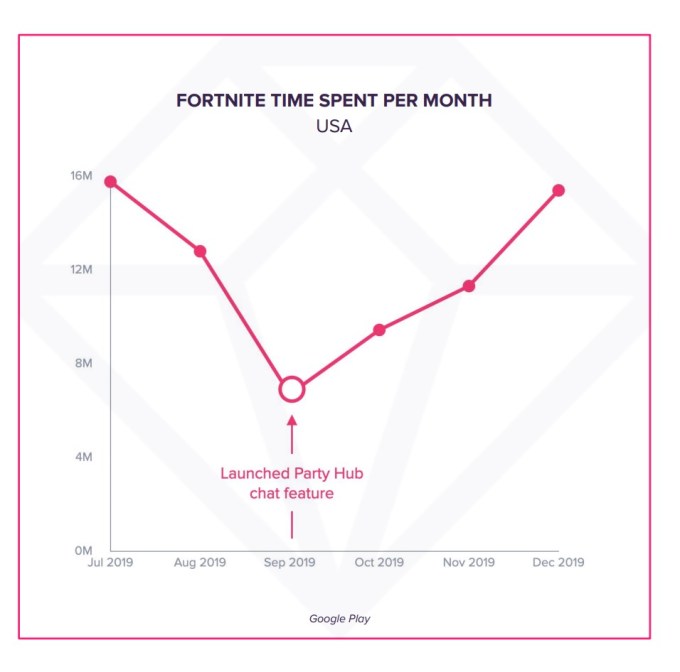
Image Credits: App Annie
Outside of games, TikTok has risen by blending elements of top categories like social, video and entertainment. After merging with Musical.ly, it has rapidly rolled out more video editing features and increased ad spend aggressively to grow its user base and drive engagement. By December 2019, U.S. users were spending 16 hours, 20 minutes in the app per month, on average, up from 5 hours, 4 minutes in August 2018.
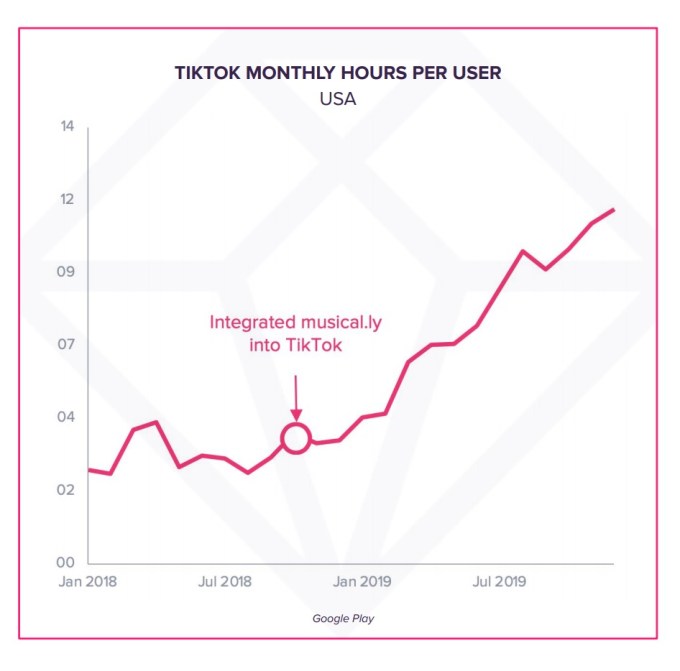
Image Credits: App Annie (note above chart only showcases Google Play data)
The full report also delves into country-by-country breakdowns but, overall, found that most countries saw record downloads in 2019 and similar trends in terms of app usage frequency increases and time spent.
One notable point of comparison is that U.S. users have more apps installed than in other markets (97 vs. 93), but tend to use fewer apps compared with worldwide trends (36 vs. 41). They also spend slightly fewer hours per day in apps, on average, than the worldwide average at 2.7 hours versus 3.1 hours.
“This report shows that the app industry is more competitive today than ever. New companies are succeeding with innovative apps that meet needs people might not even know they have,” said Ime Archibong, Head of Facebook’s New Product Experimentation team, an internal team at Facebook looking to find new models for social apps. “All of this choice and competition fuels innovation, and that’s the heart of our work at Facebook,” he added.
App Annie’s report is available upon request here.
Source: Tech Crunch

